The TCS230 color detector measures three primary colors Red, Green
and Blue and also has a separate white light detector. Since any
color can be
created from different levels of these primary colors, you can find out the color composition of a light source.
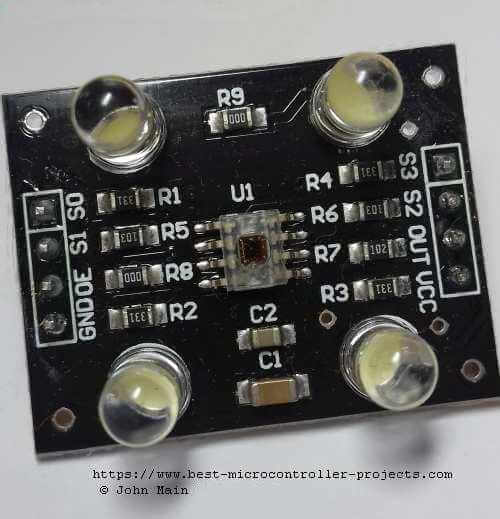
The four LEDs on the breakout
board (shown below) are there to illuminate
the subject with an even light source, making measurement more reliable.
Note: Light measurements should be made at about 1~3cm to get
a more accurate result.
You can use the TCS230 (or newer device TCS3200 see
here for differences) where you need to take action based on the color of
an object. The device reacts to infrared so may need an infrared filter or use the device in an enclosed space.
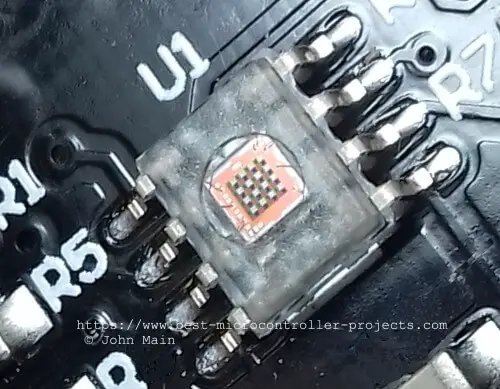
The
TSC230 chip mounted on a breakout board.
TCS230 Specification
Parameter
Value
Voltage Supply (VDD)
2V7 ~ 5V5
Abs.Max VDD
-0.3V ~ 6V3
Measurement range
Approx. 300nm to 980nm [3]
Output interface type
Frequency pin o/p single pin [2]
Logic Levels
CMOS or TTL
Logic input voltage (L,H)
0V0 ~ 0V8, 2V0 ~ VDD
Logic output voltage (L,H)
0V4, 4.5 (for VDD=5V)
Output frequency Scale 100%
600kHz (typ) [1][2]
Output frequency Scale 20%
120kHz (typ) [1][2]
Output frequency Scale 2%
12kHz (typ) [1][2]
Active current
2mA (typ), 3mA (max)
Power down current
7uA (typ), 15uA (max)
Operating temperature
-40°C ~ 70°C
[1] Output frequency controlled by registers S0,S1 to divide down output. [2] Each of the R,G,B,W outputs is selected separately in software. [3] See responsivity graph.
The output from TC230 is from a single square wave output that
changes frequency with the amount of light sensed. The specific sensor
R,G,B or W is selected using two digital control inputs (S0 and S1).
The frequency of the square wave is proportional
to the amount of light falling on a set of light detecting diodes. Since there
are four different sources of information red, green, blue and clear
photodiodes - each of these is selected in-turn using (S0 and S1). So only one
set of photodiodes is connected at a time to generate the output.
The chip inputs, S2 and S3, control
the output frequency divider logic which you an use to get a different
output frequency proportional to the colour level. You can select a
longer output pulse to accommodate slow processor measurement capability
- but the reading averages to the same output value regardless of
frequency output.
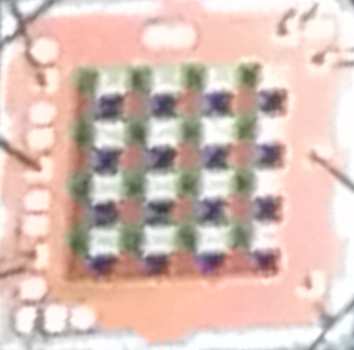
In the photo below you can see the individual red, blue, green and clear
filters. It's a bit blurry - but that was a very difficult photo to get and
remember each section is 120um square so each one is about the width of a hair
(17-181um) [Brian ley]!
Close up
of the TCS230
Zoomed
in filters of the TCS230 from image above.
In fact several photodiodes for each color are connected in parallel and
these are spread evenly over the sensor surface - you can see this in the photo
above. This layout obtains an overall reading for each color not just from an individual photodiode. For the
TCS230 there are a total of 64 photodiodes. 16 have a red filter above them, 16
have a green filter, 16 have a blue filter and 16 have a clear filter.
Block Diagram showing how the Chip works
Note: There is also an output enable that tristates the output
when high (OEn). This would allow you to attach several different TCS230 chips
to detect colors from different parts of a machine using only one input. When
using only one device set it low permanently.
Signal output
The signal output by the TCS230 is obtained by a current to frequency
converter that takes as its input the average current from the selected set of
photodiodes. The idea is that you switch one set on, take a reading and then
switch to the next set until all four measurements are done. The output signal
is a square wave with even mark to space ratio: 50% high, 50% low.
Frequency Dividers
The square wave output by the device can also be divided down (internally in the TCS230) and this
allows slower processors to to make measurements more easily. There is no
measurement penalty as the divided down output is simply an average of the
original. The only disadvantage is that because the signal is of a lower
frequency you can not make measurements as quickly.
If it was important to make a light reading very fast then you would want to
use a high speed processor and not divide down the output signal. You can
imagine that this might become important in an industrial process measurement
e.g. for measuring the state of a product e.g. you would want to quickly
measure the color of an item on a conveyor belt, and reject it if it as the
wrong color.
Frequency outputs
The maximum full scale frequency output from the TCS230 are shown
below for
the scaling factors controlled by S0 and S1. Scaling is really just
using an internal clock chip that counts the input signal (the primary
clock output from the photodiode current to frequency converter) and
generates divided down clocks.
Control
Scaling
S0
S1
Max output frequency kHz
%scale
H
H
600kHz
100%
H
L
120kHz
20%
L
H
12kHz
2%
L
S1 = L
Power down
Power down
Control
Photodiodes
S2
S3
Selected Photodiodes
L
L
Red
L
H
Blue
H
L
Clear
H
H
Green
Note: For the TCS230, TCS3200 and TCS3210 the above parameters are
identical.
How to use the TCS230
On an Arduino the easiest way to use the TCS230 is to use the pulseIn() function, first setting the dividers
to output the lowest frequency.
Difference between TC230 and TCS3200
Specification of the TCS230 where different
to TCS3200 and TCS3210
Parameter
TCS230
TCS3200/[TCS3210]
Units
Number of photodiodes
64
64 / [24]
-
Power on current
2 (max 3)
1.4 (max 2)
mA
Power down current
7 (max 15)
0.1 (max 0.1)
uA
min operating temp.
0
-40
°C
Note: Typical values are shown above.
From the above table you can see that the TCS3200 and TCS3210 have been
optimized for low power operation (in power down mode) and also for operation below 0°C.
If you want really low power when the chip is in shut down mode, then
the TCS3200/3210 have a guaranteed maximum of 0.1uA, whereas the TCS230
can go up to 15uA. The TCS3200/3210 can also operate up to -40°C, whereas the TCS230 can't operate below 0°C.
TCS230 Circuit Layout
Figure 1 : Fritzing Layout for the TCS230 or
TCS3200 breakout board
The following schematic shows connections from a TCS230 breakout
board to an Arduino Uno, with output on pin 4 and the two photodiode selector
muxes on S0 and S1 (attached to pins 10 & 11).
The output frequency divider controls are on S2 and S3 ( attached to pins 1 & 2). The output
enable is on pin 7, and the digital output from the TCS230 is connected
to the Uno as an input on pin 4.
Software Library and versions
Arduino IDE
Version
Version : 1.8.3
Library
None used: Just use the function pulseIn.
Example Sketch for Arduino UNO
Hitting any key will both show you the current sensor readings (RGB) and try
to detect the current color. Current colors are stored in two arrays:
int RGB[[NUMCOL][3]
char colname[NUMCOL][11]
The RGB array holds the color values to be found while the colname array
holds the text you want to display for the corresponding RBG value.
Warning: When you first use the code, the colors will NOT be
detected correctly since your lighting setup and detection objects will be
different to mine. Follow the calibration process below.
TCS230 Calibration
The sensor is very sensitive to any changes in light and in practice that
means any slight distance changes from the sensor to the object will cause a
different reading. Additionally any ambient light changes will also cause a
different reading.
So to make accurate (repeatable) readings you need to control two
elements:
Ambient light.
Distance to object.
To calibrate the sensor, push the sensor down onto colored paper as even a
small adjustment fails since the sensor is extremely sensitive.
Set the serial monitor to 115200 Baud and push the sensor down and hit the
'Enter' key in the serial monitor input field. This will then show you the
current RGB values. Copy these values into the RBG array and set the equivalent
colname text. Recompile (or add some different colored objects). Recompile and
check that the 'color' is found.
Now you can test the 'objects' with the code now reporting the color of the
object.
As for "real" calibration- Its difficult and the only way you will
achieve it is to place the sensor in a closed environment where you can
control the lighting levels - this will give repeatable reliable
measurements.
Click in the code below to copy it to the
clipboard.
//
// Detect colors using TCS230.
//
// Arduino uno pins for control of TCS230
#defineTCS320_OE7
#defineTCS320_S010
#defineTCS320_S111
#defineTCS320_S22
#defineTCS320_S33
#defineTCS320_OUT4
#definevariance50// Acceptable detection error 2%.
#defineSEL_RED\
digitalWrite(TCS320_S2,LOW);digitalWrite(TCS320_S3,LOW)
#defineSEL_GREEN\
digitalWrite(TCS320_S2,HIGH);digitalWrite(TCS320_S3,HIGH)
#defineSEL_BLUE\
digitalWrite(TCS320_S2,LOW);digitalWrite(TCS320_S3,HIGH)
#defineSEL_CLEAR\
digitalWrite(TCS320_S2,HIGH);digitalWrite(TCS320_S3,LOW)
#defineTWO_PER\
digitalWrite(TCS320_S0,LOW);digitalWrite(TCS320_S1,HIGH);
#definedebug(a)Serial.println((a));#defineNUMCOL5
// int RGB[NUMCOL][3]; // Five colors with 3 elements.
// Array of NUMCOL strings len 10. 11 for null.
// char colname[NUMCOL][11];
// Typical values for 2% dividers (set variance to 50).
intRGB[NUMCOL][3]={
{248,647,393},
{188,261,265},
{404,710,546},
{506,493,304},
{930,1199,837},
};
charcolname[NUMCOL][11]={
"red",
"yellow",
"brown",
"blue",
"black",
};
////////////////////////////////////////////////////////////////
voidsetup(){
pinMode(TCS320_OE,OUTPUT);
pinMode(TCS320_S0,OUTPUT);
pinMode(TCS320_S1,OUTPUT);
pinMode(TCS320_S2,OUTPUT);
pinMode(TCS320_S3,OUTPUT);
pinMode(TCS320_OUT,INPUT);
TWO_PER;
digitalWrite(TCS320_OE,LOW);// On always.
Serial.begin(115200);
Serial.println("TCS230 color detector");
}
////////////////////////////////////////////////////////////////
unsignedlongget_TCS230_reading(void){
unsignedlongval;
noInterrupts();
val=pulseIn(TCS320_OUT,HIGH,20000);// 2000us=2ms 2Hz min.
interrupts();
returnval;
}
staticintclr,red,green,blue;
////////////////////////////////////////////////////////////////
uint16_tdetect(void){
unsignedlongval;
SEL_RED;
red=val=get_TCS230_reading();
Serial.print("RED: ");Serial.print(val);SEL_GREEN;
green=val=get_TCS230_reading();
Serial.print(" GREEN: ");Serial.print(val);SEL_BLUE;
blue=val=get_TCS230_reading();
Serial.print(" BLUE: ");Serial.print(val);Serial.print(" \n");}
////////////////////////////////////////////////////////////////
intwithinEQ(intc,intxl,intxh){
if(c>=xl&&c<=xh)return1;
return0;
}
////////////////////////////////////////////////////////////////
// Compare a value to a value and variance.
intcompare(intc,intv,interr){
intxh=v+err,xl=v-err;
if(withinEQ(c,xl,xh))return1;
return0;
}
////////////////////////////////////////////////////////////////
voidloop(){
uint8_tchr,i,fnd;
if(Serial.available()>0){
chr=Serial.read();// Consume.
// Find color match.
detect();
fnd=0;
for(i=0;i<NUMCOL;i++){if(compare(red,RGB[i][0],variance)&&
compare(green,RGB[i][1],variance)&&
compare(blue,RGB[i][2],variance)){// Found
Serial.print("Col is :");Serial.println(colname[i]);fnd=1;
break;
}
}
if(!fnd)Serial.println("NOT Found");}
}
Why does the code use 2 percent dividers?
You can choose to use raw 100%, 20% or 2% output and most other code
examples use 20%.
The function used to measure the output of the chip is pulseIn, which is
accurate to 4us, so to get maximum accuracy we need an output that is big
enough compared to the accuracy of pulseIn.
The following data is taken from my setup which is probably an average
lighting setup in an office. These are provided to show the typical minimum and
maximum periods in microseconds that are available for measurement using the
pulseIn function.
The questions to be answered are:
What effect does changing the divider output
from the TCS230 have on the output periods to be measured?
How does changing the dividers affect the output periods?
Typical output for 2 percent dividers:
{248,647,393},
{188,261,265},
{404,710,546},
{506,493,304},
{930,1199,837}
The maximum and minimum periods from the above measurements are:
1199us and 188us
Here the frequencies involved are :
1.0/1199e-6 = 834Hz to 1.0/188e-6 = 5319Hz
(5.3kHz). (max is 12kHz - T=83us).
Typical values for 20 percent dividers:
{18,26,26},
{48,47,30},
{40,69,54},
{27,71,43},
{92,119,83}
The maximum and minimum periods from the above measurements are:
119us and 18us.
Here the frequencies involved are :
1.0/119e-6 = 8403Hz to 1.0/18e-6 = 55555Hz (55kHz).
(max is 120kHz - T=8.3us).
Typical values for raw output
The quoted max frequency is 600kHz - not measured. The period will be
1.6us.
Conclusion
For the 20% dividers you are getting close to the measurement capability of
pulseIn which is 4us i.e the minimum period measured was 18us and that is only
-5 counts of pulseIn data. So that measurement is getting close to being too
small and therefore less accurate i.e. the difference between colors will need
to be larger to register a difference in the chip output = less sensitive.
The resolution here is 22% of the minimum period which is fairly bad.
The periods for 100% output will be even smaller (1.0/600e3 = 1.6us) and
that would not be measurable using pulseIn - you may be able to do it using the
asynchronous input in Timer 2.
When the 2% dividers are used the program can make the most accurate period
measurement since the periods output by the chip are long compared to the
pulseIn accuracy of 4us. i.e the lowest period measured was 188us for these
dividers ( ~48 periods of 4us ) compared to 18us ( ~5 periods of 4us ) for the
20% dividers.
The resolution here is 2.13% of the minimum period which is quite good.
Therefore the 2% divider output is the better option for measurement accuracy.
Warning: The light detector is extremely sensitive so although
you can get maximum accuracy the periods measured will change a lot depending
on the lighting conditions and object distance. That is why the variable
'variance' allows you to specify an error value around each RBG center point
for reliable color detection.
Details on Color Detection
The spectral response of the photodiodes is interesting in that all the
photodiodes react to infrared light (periods above 700nm). When you add in the
green and blue filters, each response shows two peaks one in the visible
spectrum and one in the infrared spectrum. So when you use the TCS230 or
TCS3200 (same photodiodes) for measuring red, green, blue or white light you
will be actually gathering an infrared response as well. So this is definitely
not the same response as your eye's response to light.
The question is: Does that really matter? ...and the answer is: It
depends!
If your project is trying to measure a response that is as close as possible
to a human eye response then yes it does matter. If on the other hand, the
project is sorting items based on color, and is used in a well defined
environment, (not changing between florescent and incandescent bulbs) then no,
it does not matter.
As long as the detector is enclosed in a defined environment then it will
always operate the same way i.e. within a machine closed in, with its own LED
light source; The output of the detector will generate the same measurement
results (however, consider aeging and temperature effects).
Note:The TCS230/3200 detector is extremely sensitive so even
changing the distance of the object to the sensor will change the measured
colors -depending on ambient light conditions - so removing infrared detection
may not solve detection problems anyway.
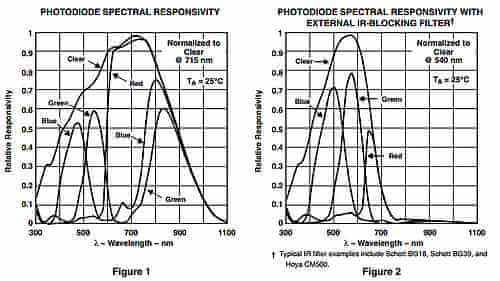
In the data sheet for the TCS230 there are two spectral diagrams: copied
below . In addition I have added the color spectrum chart from wikipedia that
shows a human eye response.
It is important to note that the color detection of the photodiodes
themselves is affected by infrared and to get a better result that is not
affected by infrared you have to use an infrared filter.
Color
Wavelength (nm)
Red
700 ~ 635
Green
560 ~ 520
Blue
490 ~ 450
This is the response of the TCS230 with no infrared filter on the left and
with an infrared filter on the right.
[Source: the TAOS datasheet].
On the left you can see that the Green response has two peaks (~550nm and
~830nm) , the Blue response has two peaks (~470nm and ~800nm) and the Red
response goes from 600nm to 1100nm. The maximum response you really want is
from 450nm to 700nm, since the 700nm wavelength is the maximum your eye can
detect. This means any infrared radiation that your eye can not see will
affect Red, Green and Blue readings unless an IR filter is used.
Filters suggested by TAOS are:
Schott BG18
Schott BG39
Hoya CM500
When you use an IR filter(right hand diagram above) the filter smoothly
chops out wavelengths above 700nm and there is only one peak response per type
of photodiode. The response is far more similar to the human eye response shown
below.
[source
https://en.wikipedia.org/wiki/Color]
The only trouble with those Hoya or Schott filters is tha they cost a lot
more than the sensor itself; You can find a cheap IR filter on ebay by
searching for X2 ir-cut CS lens mount.
Conclusions
TCS230 Color Detection
The best way to get a more accurate color detection, that more closely
matches the human eye response, is to use an infrared filter in front of the
the sensor. Note that this also applies to the TSC3200 and TCS3210 as these
also employ similar photodiodes that have similar response curves.
However you can still use the devices without an IR filter and will still
get color results as long as the lighting conditions and distance from the
object are kept constant.
Divider control (S3, S4)
Most code uses 20% divider operation - this gives out pulses that are
too small for pulseIn - on an Arduino Uno - (it just about manages to
measure them). It is therefore better to use 2% dividers resulting in
longer output pulses that pulseIn can easily measure.
Written by John Main who has a degree in Electronic Engineering.
Arduino Float to String: Is there a simple function that does this for you? What is the one thing you must do to ensure your program is reliable?: Find out here.


Comments
Have your say about what you just read! Leave me a comment in the box below.
Don’t see the comments box? Log in to your Facebook account, give Facebook consent, then return to this page and refresh it.